Landscapes
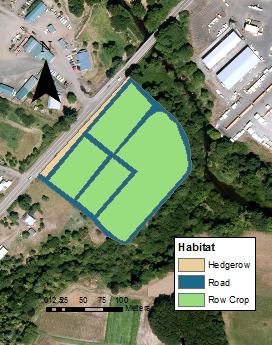
Farm attributes
To achieve the fine scale needed to examine the effects of farm attributes on community structure, we manually digitize land cover on each farm in ArcGIS (Fig. 1.). We use this layer to examine the effects proportion of land usage on farms and landscape heterogeneity. We will also gather information about crop heterogeneity and pollinator plants through a survey sent to growers in the study.
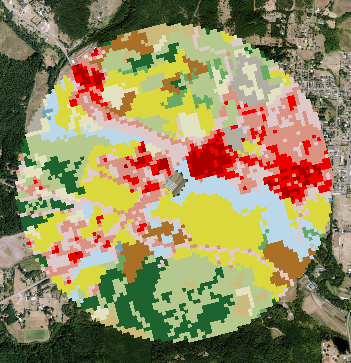
Surrounding Landscape
We are using National Land Cover Database layers to examine the influences of surrounding land usage and surrounding landscape heterogeneity on on farm bird diversity (Fig. 2).
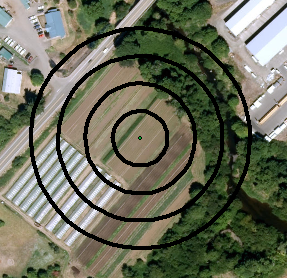
Bird Surveys
We will use a technique called point count surveys to index farm bird diversity twice per year in 2016 and 2017. Farms are surveyed from south to north during each sampling occasion. One point with 100 m radius is surveyed for every 4 ha of farmed land and stratified to encompass land usages present on farms that may provide habitat to different species (Fig. 3). Surveys are conducted between sunrise and 1100 hours. We record each individual bird seen or heard during a 10 min period.